Appearance
Manager Dashboard — Advanced Sections
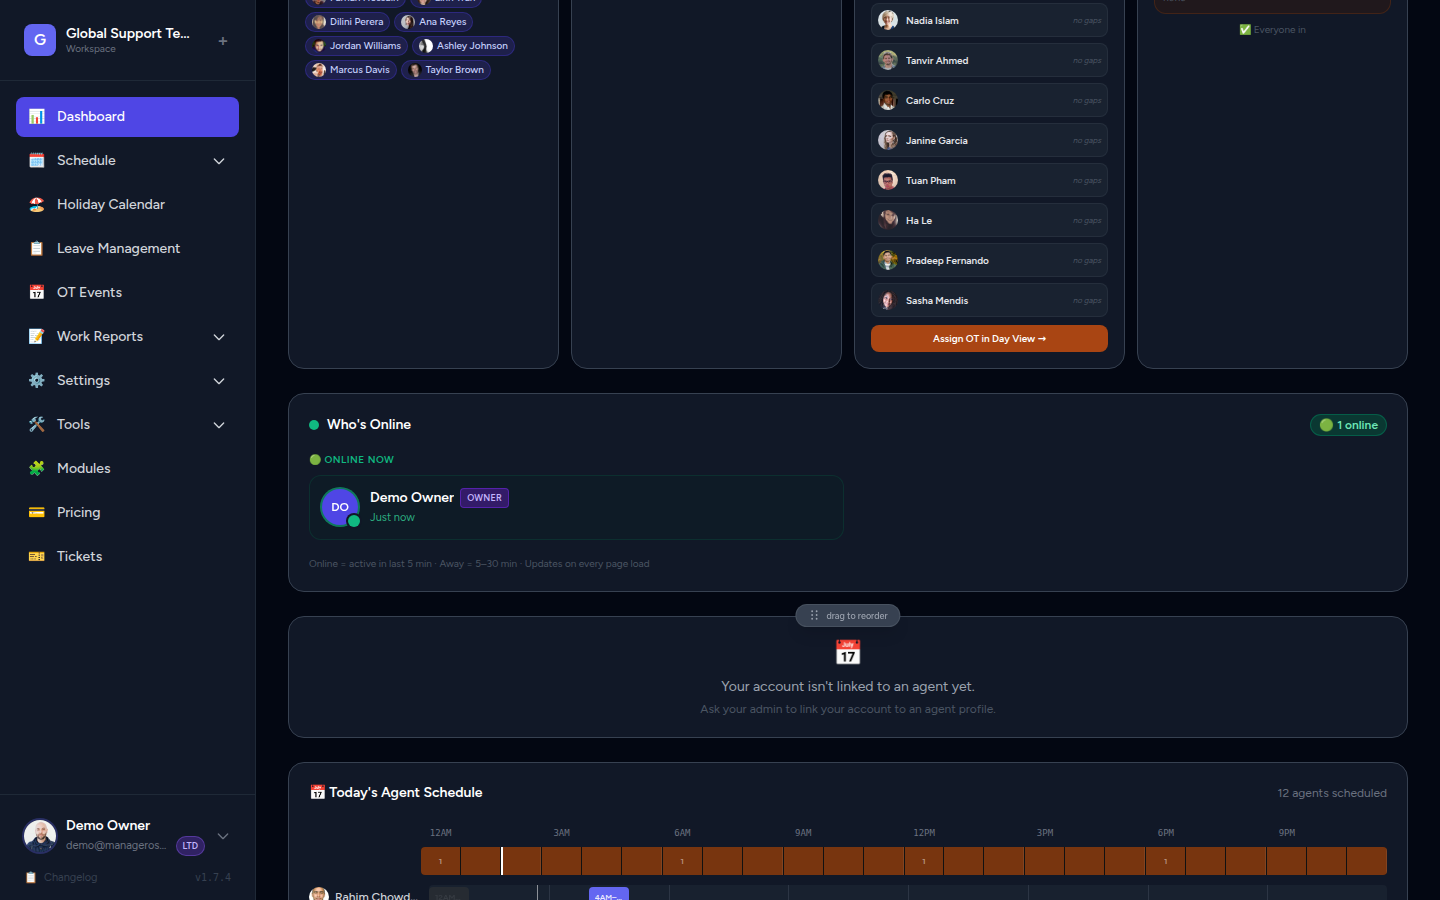
The Manager Dashboard is the command center for your team. It gives you a live read on coverage, attendance, scheduling, and agent activity — all in one place.
This guide covers the dashboard's modular layout, each available section in detail, and how to customize the order to fit your workflow.
Dashboard Layout Overview
The Manager Dashboard uses a modular, draggable card layout. Each section (card) can be repositioned to match how you prefer to work. Your layout is saved per user in browser localStorage, so each manager keeps their own arrangement.
Who sees the dashboard?
The full Manager Dashboard — including all sections below — is visible to Admins and Owners. Agents with portal accounts see a simplified view (My Week, limited metrics). See the Who's Online doc for visibility rules on that specific section.
How to Reorder Sections
The dashboard layout is fully customizable without any settings page.
- Hover over any card — a drag handle (⠿) appears at the top center of the card.
- Click and hold the drag handle.
- Drag the card to your preferred position in the grid.
- Release — the card snaps into place and the new order is saved automatically to browser localStorage.
📸 Screenshot: Dashboard card mid-drag, showing the drag handle at top center and a drop zone highlighted below
Reorder works on desktop and tablet
Drag-to-reorder requires a pointer device. On mobile (touch-only), sections stack vertically in their current saved order; reordering is not available on small screens.
Resetting to Default Order
If you want to start fresh:
- Scroll to the bottom of the dashboard page.
- Click the link: "Reset section order to default".
- The page reloads with all cards back in their original positions.
This resets your layout only
Resetting the order does not affect any data, schedules, or settings — only the visual arrangement of cards on your dashboard.
Mobile Behaviour
On small screens (phones and narrow tablets), all dashboard sections stack vertically in a single column. The drag-to-reorder feature is not available on mobile, but your saved desktop order is preserved and resumes when you return to a wider screen.
Dashboard Sections (Default Order)
1. Banner — Right Now
The Banner sits at the top of the dashboard and gives you the most critical numbers at a glance.
📸 Screenshot: Banner section showing live clock, coverage percentage, gap count, and on-duty agent count for the current hour
| Element | Description |
|---|---|
| Live clock / date | Current time or date indicator — always reflects real time |
| Current hour coverage | Percentage of this hour that is covered by on-duty agents |
| Gap count | Number of uncovered time gaps detected today |
| On-duty agent count | How many agents are actively on shift right now |
The Banner is always the starting point
Even when reordering cards, many admins keep the Banner at the top — it's the fastest way to know if anything needs immediate attention.
2. Metrics
The Metrics section provides a deeper breakdown of today's staffing and coverage.
📸 Screenshot: Metrics section with On Duty count, OT agents, 24h coverage bar, and Who's Out panel
| Element | Description |
|---|---|
| On Duty count | Total agents currently on shift |
| OT today | Agents who are working overtime today (beyond their scheduled hours) |
| 24h coverage bar | A horizontal bar spanning the full day, showing covered (green) and uncovered (red/grey) time segments |
| Coverage % | Overall coverage percentage for the day |
| Gap time ranges | Specific time ranges where coverage falls below minimum threshold |
| Who's Out today panel | A compact list of agents who are absent today (holiday, approved leave, or no shift) |
The 24h coverage bar is particularly useful for spotting patterns — a red gap at 3 AM might be expected, but one at 10 AM needs action.
3. Who's Online
The Who's Online section shows which team members are currently active in the portal.
📸 Screenshot: Who's Online panel showing two agents with green pulsing dots (Online) and one with an amber dot (Away)
This is a live presence panel — it does not reflect who is on shift, only who has the portal open or recently visited. See the dedicated Who's Online guide for full details on:
- Online vs. Away vs. Offline states
- Role badges (Owner, Admin, Agent)
- How the last-seen timestamp is updated
- Visibility rules (Admins and Owners only)
4. My Week
The My Week section is visible to agents who have portal accounts. It shows their own scheduled shifts for the current week.
📸 Screenshot: My Week section showing a 7-day week view with this agent's scheduled shifts highlighted in their agent color
| Element | Description |
|---|---|
| 7-day view | Monday through Sunday for the current week |
| Shift blocks | The agent's scheduled working hours per day |
| Off / Holiday / Leave | Days marked as off, holiday, or approved leave |
| OT indicator | Highlights if the agent is working overtime on any day |
Admins also see My Week
If an admin account is also set up as an agent with shifts, they will see My Week too. If they have no scheduled shifts (admin-only account), this section may be empty or hidden.
5. Gantt
The Gantt section provides a 24-hour horizontal schedule bar chart for all agents, for the day currently being viewed.
📸 Screenshot: Gantt chart showing horizontal bars for each agent across a 24-hour timeline, with gaps visible as empty space
| Element | Description |
|---|---|
| Agent rows | One row per agent, labelled with their name and avatar |
| Shift bars | Colored horizontal bars showing when each agent is on duty |
| Current time marker | A vertical line showing the current time of day |
| Gaps | Uncolored space between shift bars where coverage is missing |
The Gantt is the best view for understanding how coverage flows across the full 24-hour period and spotting handover gaps between shifts.
Navigating dates on the Gantt
Use the date navigator above the dashboard (or on the Gantt card itself) to jump to past or future days. The coverage bar and gap count in the Banner and Metrics sections will update to reflect the viewed day.
6. Monthly Stats
The Monthly Stats section summarizes the current month's scheduling performance.
📸 Screenshot: Monthly Stats section with working days count, coverage percentage, agent OT breakdown table, and heatmap legend
| Element | Description |
|---|---|
| Working days | Total scheduled working days in the month |
| Coverage stats | Month-to-date coverage percentage and total gap hours |
| Agent OT breakdown | Table listing each agent and their overtime hours for the month |
| Heatmap legend | Color key explaining the coverage levels used in the Heatmap section below |
7. Heatmap
The Heatmap gives you a month-at-a-glance visual — a calendar-style grid where each day is color-coded by coverage level.
📸 Screenshot: Heatmap section showing a monthly grid where each cell is colored green, amber, or red based on coverage, with small dots indicating agent on/off status
| Element | Description |
|---|---|
| Day cells | Each cell represents one calendar day |
| Coverage color | Green = well-covered, Amber = partial, Red = critical gap or no cover |
| Coverage % | Percentage shown inside or below each day cell |
| Agent dots | Compact dot indicators showing which agents are on / off that day |
| OT hours | Small OT figure when any agent worked overtime that day |
The Heatmap is ideal for identifying patterns across the month — for example, a recurring coverage dip on Fridays or a peak gap period in the last week of the month.
8. Who's Out
The Who's Out section shows agents who are currently absent and those coming up for leave or holiday this week.
📸 Screenshot: Who's Out section showing two panels — "Out Today" with agent cards and "This Week" with a compact list of upcoming absences
| Panel | What it shows |
|---|---|
| Out Today | Agents on approved leave or holiday today, with reason and return date |
| This Week | Upcoming leaves and holidays for the rest of the current week |
Link to Holiday Calendar
Holiday entries in the Who's Out section link directly to the Holiday Calendar for more detail. Leave entries link to the leave request details.
9. Upcoming
The Upcoming section looks further ahead — showing leaves and holidays for the next 7–14 days so you can plan ahead.
📸 Screenshot: Upcoming section showing a list of future leaves and holidays with agent names, dates, and coverage impact indicators
| Element | Description |
|---|---|
| Agent name + avatar | Who will be absent |
| Date range | Start and end of the leave or holiday |
| Type badge | Leave (blue) or Holiday (orange) |
| Coverage indicator | A quick risk indicator if the absence creates a coverage gap |
Use Upcoming alongside the Holiday Calendar coverage mini-cards to proactively arrange cover before a gap becomes an incident.
10. Notepad
The Notepad is a private, free-text scratchpad — personal notes visible only to you.
📸 Screenshot: Notepad section with a text area containing admin notes, auto-save indicator in the corner
| Element | Description |
|---|---|
| Text area | Free-form text, any length |
| Auto-save | Changes are saved automatically to your workspace user account — no Save button needed |
| Private per user | Each user has their own notepad; no one else can see your notes |
What to use the Notepad for
Common uses: shift briefing notes, follow-up items, temporary reminders, shift handover notes. Since it saves to your account (not localStorage), your notes persist across browsers and devices.
Section Reference Table
| # | Section | Key Content | Audience |
|---|---|---|---|
| 1 | Banner | Live clock, current coverage %, gap count, on-duty count | All admins |
| 2 | Metrics | On Duty, OT agents, 24h bar, coverage %, gaps, who's out | All admins |
| 3 | Who's Online | Live portal presence (Online / Away) | Admins & Owners |
| 4 | My Week | Agent's own weekly schedule | Agents with accounts |
| 5 | Gantt | 24h horizontal schedule for all agents | All admins |
| 6 | Monthly Stats | Working days, coverage %, OT breakdown, legend | All admins |
| 7 | Heatmap | Color-coded month calendar with coverage & OT | All admins |
| 8 | Who's Out | Today's absences + this week's upcoming absences | All admins |
| 9 | Upcoming | Leaves & holidays for the next 7–14 days | All admins |
| 10 | Notepad | Private free-text notes, auto-saved per user | All users |