Appearance
Work Report Dashboard
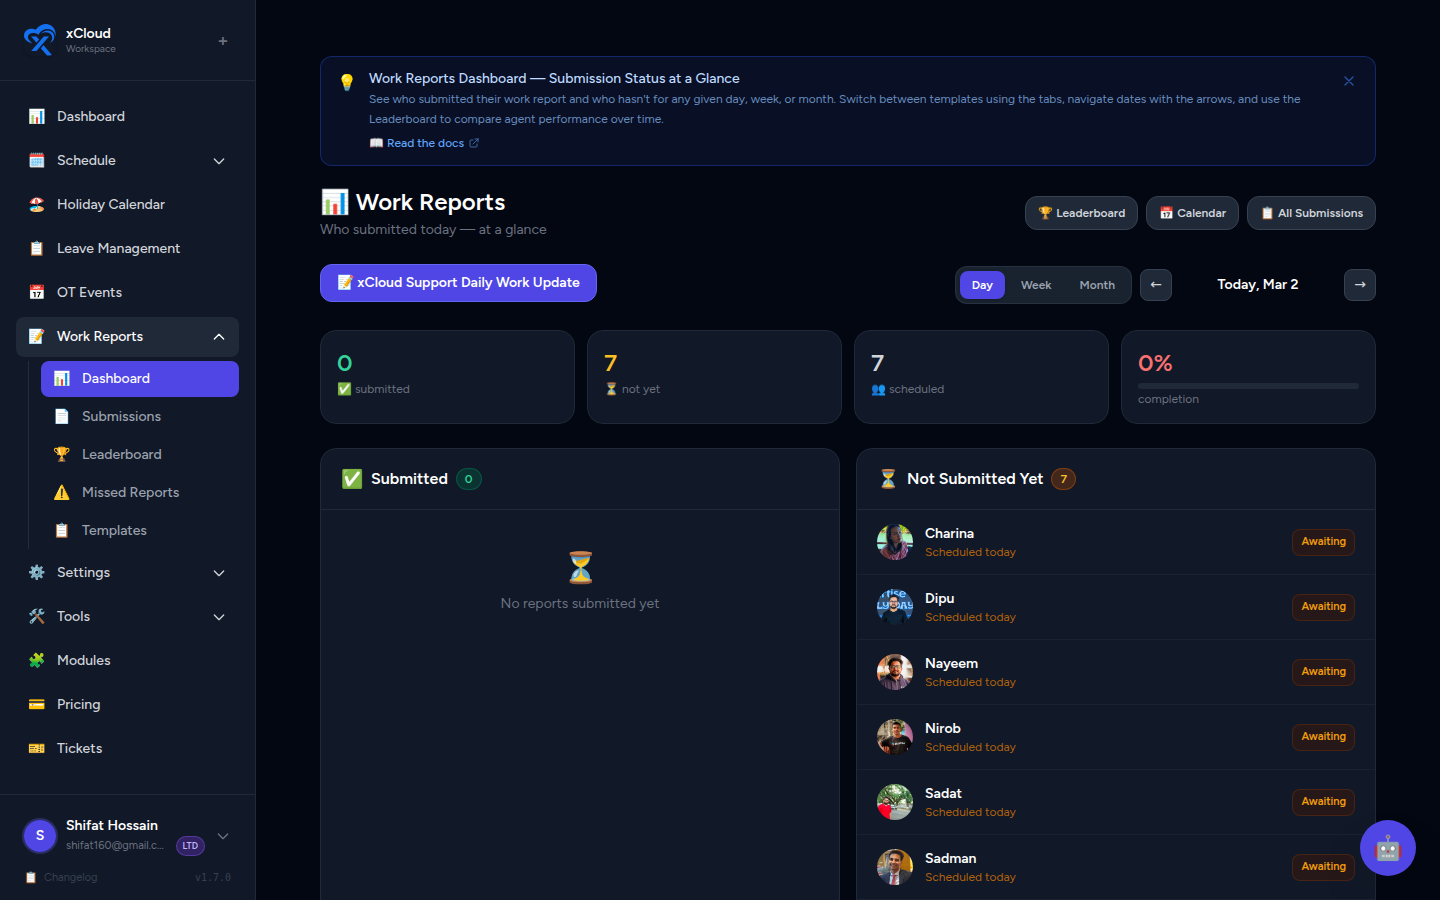
The Work Report Dashboard is the primary submission-status view for admins. It shows, at a glance, which agents have submitted their work reports and which are still pending — for any template, any day, week, or month.
Who can access this?
The Dashboard is only visible to users with the Owner or Manager role. Regular agents cannot see this page.
Accessing the Dashboard
- In the left sidebar, click Work Reports.
- Click the Dashboard tab, or navigate directly to
/admin/work-reports/dashboard.
📸 Screenshot: Work Reports navigation with the Dashboard tab active
Default State on Load
When you first open the Dashboard it automatically:
- Sets the range to Day view.
- Selects the first available template from the template tabs.
- Displays today's submission status.
You can immediately start navigating or switch templates without any extra setup.
Template Tabs
At the top of the Dashboard, each of your configured Work Report Templates appears as a clickable tab.
- Click a tab to switch the entire Dashboard view to that template.
- The submission counts and agent lists update to reflect submissions made against the selected template.
- If only one template exists it is selected automatically and no tab switching is needed.
📸 Screenshot: Template tabs across the top of the Dashboard with the active tab highlighted
Why multiple templates?
Some workspaces use different report templates for different teams or shift types. The template tabs let you monitor each group's submissions separately without leaving the Dashboard.
Range Toggle & Date Navigation
Use the controls at the top of the Dashboard to adjust the time period you are viewing.
| Control | Description |
|---|---|
| Day / Week / Month | Toggle between a single day, a 7-day week, or a full calendar month |
| ← arrow | Go to the previous period |
| → arrow | Go to the next period |
| Today button | Jump back to the current period (hidden automatically when you are already viewing the current period) |
📸 Screenshot: Dashboard controls showing Day/Week/Month toggle, prev/next arrows, and the Today button
The Today button disappears when it's not needed
If you are already viewing the current period, the Today button hides itself to reduce clutter. It reappears as soon as you navigate away from the current period.
Main Panels
The central area of the Dashboard is split into two panels side by side.
Submitted Panel
Lists every agent who has submitted a work report for the selected template and period.
- Shows the agent's name and any relevant submission metadata.
- Reflects reports in Submitted or Reviewed status.
📸 Screenshot: Submitted panel showing a list of agent names with submission timestamps
Not Yet Panel
Lists every agent who is scheduled for the period but has not yet submitted a report.
- These are agents still pending — their reports are either missing or in Draft.
- Use this panel to quickly identify who needs a follow-up.
📸 Screenshot: Not Yet panel showing a list of agents with no submission for the current period
Draft ≠ Submitted
An agent who has started but not yet clicked Submit appears in the Not Yet panel. A Draft is not counted as a submission.
Off / Not Scheduled Strip
Below the two main panels, a horizontal Off / Not Scheduled strip shows agents who are not scheduled to work during the selected period.
- These agents are not expected to submit a report.
- They do not count toward submission rate calculations.
- The strip provides a complete picture of your entire roster at once.
📸 Screenshot: Off/Not Scheduled strip at the bottom of the Dashboard showing agents with no scheduled shifts in the period
Stat Bar
A summary stat bar sits above the main panels and provides three key numbers at a glance:
| Stat | Description |
|---|---|
| Submission Rate % | Percentage of scheduled agents who have submitted for this period |
| Total Submitted | Absolute count of agents who have submitted |
| Total Pending | Absolute count of scheduled agents who have not yet submitted |
📸 Screenshot: Stat bar showing "Submission Rate: 72% · Submitted: 18 · Pending: 7" across the top of the panels
Use the stat bar for quick health checks
A low submission rate early in the day is normal. By end-of-day, if the rate is still low, the Not Yet panel tells you exactly who to follow up with.
Switching Between Views
| Scenario | Recommended view |
|---|---|
| Monitoring today's status | Day view |
| Weekly team health check | Week view |
| Month-end review | Month view |
| Checking a specific template's adoption | Switch template tab, then select period |
Related
- Work Reports — Admin Guide — Full admin overview including templates and notifications
- Work Report Leaderboard — Ranked agent performance metrics
- Work Report Calendar View — Visual agent × date submission heatmap