Appearance
Work Report Leaderboard
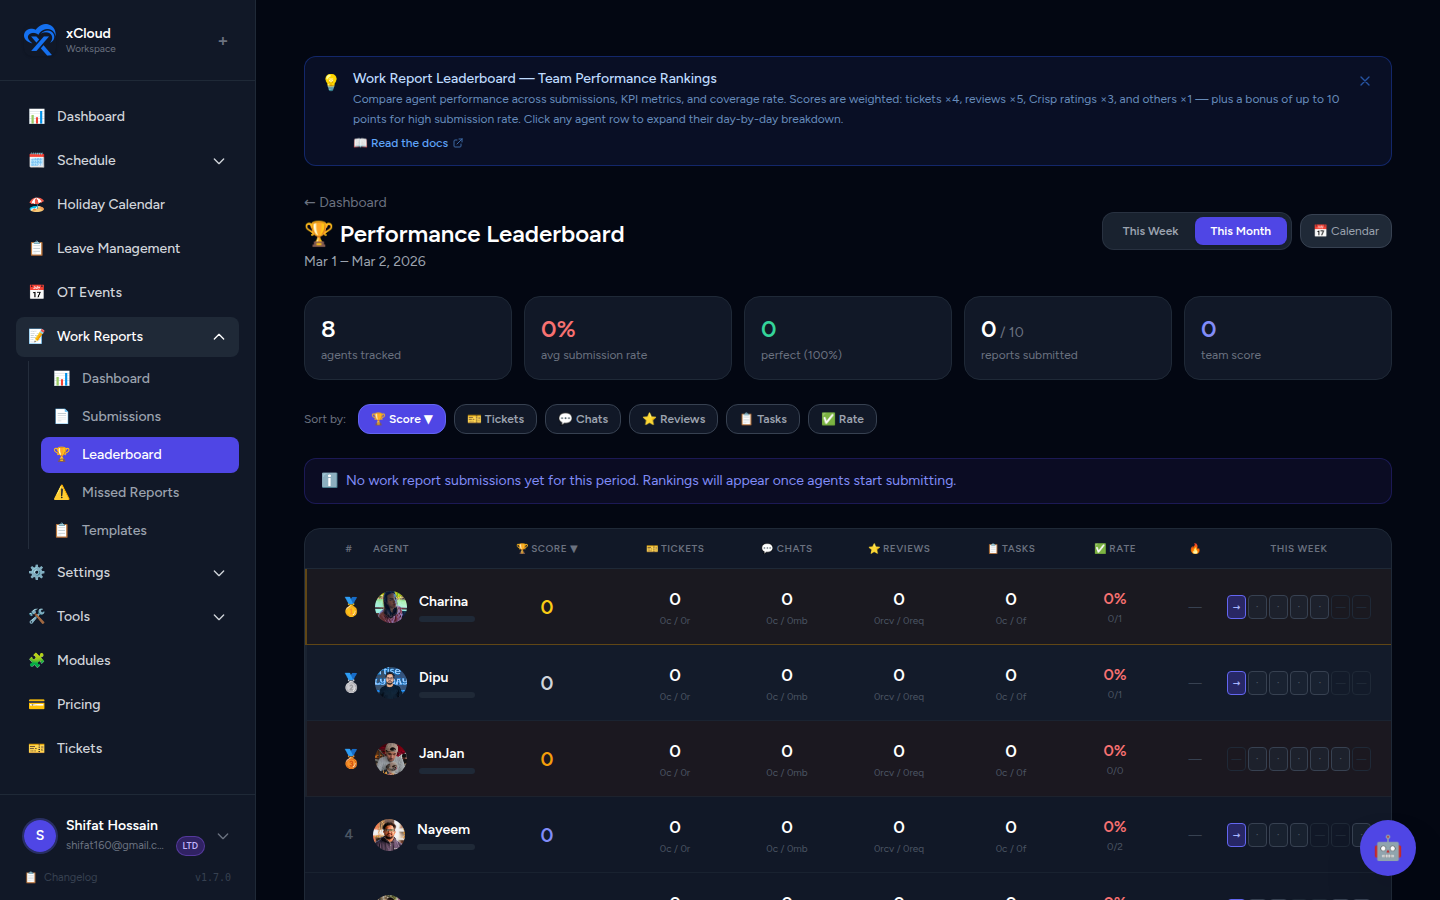
The Work Report Leaderboard gives owners and managers an at-a-glance view of agent performance based on work report submissions. It ranks agents by a weighted score and lets you drill down into daily breakdowns for any individual.
Who can access this?
The Leaderboard is only visible to users with the Owner or Manager role. Regular agents cannot see this page.
Accessing the Leaderboard
- In the left sidebar, click Work Reports.
- Click the Leaderboard tab, or navigate directly to
/admin/work-reports/leaderboard.
📸 Screenshot: Work Reports section with the Leaderboard tab highlighted in the navigation bar
Date Range & Navigation
By default, the Leaderboard loads in Month view, starting from March 2026.
| Control | Description |
|---|---|
| Week / Month toggle | Switch between a 7-day or full calendar-month view |
| ← / → arrows | Navigate to the previous or next period |
📸 Screenshot: Leaderboard header showing Week/Month toggle and period navigation arrows
Comparing periods
Use the navigation arrows to compare team performance across different weeks or months. Each period renders a fresh ranking based on that period's data only.
Leaderboard Columns
Every agent's row contains the following metrics. All columns are sortable — click a column header to sort ascending or descending.
| Column | Description |
|---|---|
| Agent Name | Agent's display name, with a medal for top-3 ranked agents |
| Submissions | Number of work reports submitted in the period |
| Days Scheduled | Number of days the agent was scheduled to work |
| Coverage Rate (%) | Percentage of scheduled days with a submitted report |
| Score | Weighted performance score (see formula below) |
| Tickets Closed | Total tickets the agent reported closing |
| Crisp Ratings | Total Crisp chat ratings received |
| Reviews Received | Total review sessions received from a supervisor |
| Review Requests | Total times the agent requested a review |
| Avg Handle Time | Average time taken to handle a task, as reported in submissions |
📸 Screenshot: Full leaderboard table with all columns visible, sorted by Score descending
Score Formula
Each agent's Score is calculated from their submission data using the following weights:
| Metric | Weight |
|---|---|
| Tickets Closed | × 4 |
| Reviews Received | × 5 |
| Review Requests | × 2 |
| Crisp Ratings | × 3 |
| All other numeric fields | × 1 |
| Coverage Rate bonus | up to +10 bonus points |
The coverage rate bonus rewards consistent submission habits. Agents with a higher coverage rate earn proportionally more bonus points on top of their base score (maximum +10).
What moves the score the most?
Reviews Received (×5) and Tickets Closed (×4) carry the heaviest weight. Agents who close more tickets and actively participate in review sessions will climb the leaderboard fastest.
Medal Rankings
The top three agents by score receive a medal badge displayed next to their name:
| Medal | Rank |
|---|---|
| 🥇 Gold | Rank 1 |
| 🥈 Silver | Rank 2 |
| 🥉 Bronze | Rank 3 |
Medals update automatically whenever the period or sort order changes.
📸 Screenshot: Top three rows of the leaderboard showing gold, silver, and bronze medal icons next to agent names
Expanding an Agent's Day-by-Day Breakdown
Click any agent's row to expand a detailed daily breakdown panel beneath it. The panel shows one row per day in the selected period with that day's individual metrics.
- Click the agent row — it expands in place.
- Review the day-by-day metrics.
- Click the row again to collapse.
📸 Screenshot: Agent row expanded showing a nested daily breakdown table with columns for Date, Submissions, Tickets Closed, and other per-day metrics
Days with no data
Days the agent was not scheduled, or where no report was submitted, will show as empty or zero values in the breakdown.
Team Totals Row
At the bottom of the leaderboard there is a Team Totals row that aggregates all agents' metrics for the selected period. Use it to understand overall team output without manually summing columns.
📸 Screenshot: Team Totals row at the bottom of the leaderboard table with bold totals for each numeric column
Quick Reference
| Setting | Default |
|---|---|
| Default view | Month |
| Starting period | March 2026 |
| Visible to | Owner, Manager |
| Sorting | Any column, click header |
| Medals awarded | Top 3 by Score |
| Daily breakdown | Click any agent row |
Related
- Work Reports — Admin Guide — Full admin overview including templates and notifications
- Work Report Dashboard — Submission status overview by day, week, or month
- Work Report Calendar View — Visual agent × date submission heatmap